
This is a topic I brought up many years ago, but haven’t discussed lately. Just as you might have a nagging itch that just won’t go away, this one has remained with me.
GIPS requires a measure of dispersion … but of what?
Let’s begin by defining dispersion, specifically, “internal dispersion.” As per the GIPS® glossary: Internal Dispersion is “A measure of the spread of the annual returns of individual portfolios within a composite. Measures may include, but are not limited to, high/low, range, or standard deviation (asset weighted or equal weighted) of portfolio returns.” For our purposes, we will use the equal-weighted standard deviation. (The asset weighted version should be done away with, but that’s another topic which I’ve taken up in the past but won’t today).
I recently conducted a GIPS verification for a client who stated that their dispersion was a measure of variability around the composite’s return. Well, while I believe that is what it’s supposed to be, I doubted that it was. And so, I checked the math and confirmed it wasn’t.
It wasn’t what? It wasn’t “around “the composite’s return.”
Then what was it? Around the average return of the set of accounts that were present the full year.
What is it and why does it matter?
Compliant firms report dispersion when there are six or more accounts present in the composite for the full year. Okay, so let’s assume that during the year there were actually 20 accounts, but only ten were present for the full year (e.g., a few were there at the start but were removed by December (terminated, had a significant flow, fell below the minimum) and a few started after the beginning of the year. But, since there are ten present the full year, the firm must report dispersion.
And what is it we’re measuring: dispersion around the composite’s return or around the average of the ten accounts present the full year? I believe that the Standards’ intent is that it’s around the composite’s return.
Firms report how their strategy did (e.g., +3.38%) and dispersion lets us know whether the accounts were relatively close to this value (a low dispersion (meaning the accounts were managed in a consistent fashion), or widely different dispersion (meaning the accounts had a lot of variation through the year).
The math behind dispersion
For this post, by dispersion we mean equal weighted standard deviation. To measure dispersion using the composite’s return is a tad more challenging than it may seem.
Think of Excel, for example. If we isolate the returns of the accounts present the full year, all we need to do is invoke the formula STDEVP (for the population form; STDEV for sample) for these numbers and voilà, we have the answer. But this approach uses the average return of this subset of accounts, not the composite mean.
To calculate standard deviation using the composite’s return, we have to do it step by step, using this formula:
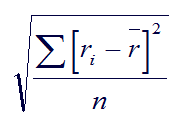
While clearly not difficult math, we need to:
- measure the average return for the set of accounts present for the full year
- calculate the differences for each of these accounts relative to the average
- square these numbers
- sum them up
- divide by the number of accounts in the set
- take the square root.
Clearly not rocket science, but a bit more tedious than “=STDEVP.” And even with programmed systems, I’m sure that there are standard deviation routines that you simply pass the numbers into, rather than construct your own standard deviation formula.
So, what’s the difference? Dispersion
Most firms will use the average of the sample of accounts, which tells us the dispersion around the sample’s average, not the composite return. And so, there’s a philosophical difference, we might say, as to what we’re actually doing. do we care about how consistent this subset of returns did, or how the dispersion was relative to the composite return that is being reported?
Does it really matter? Dispersion
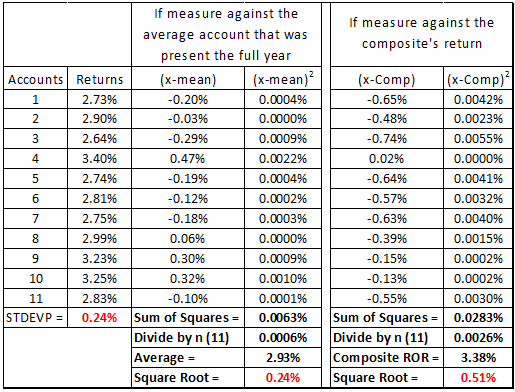
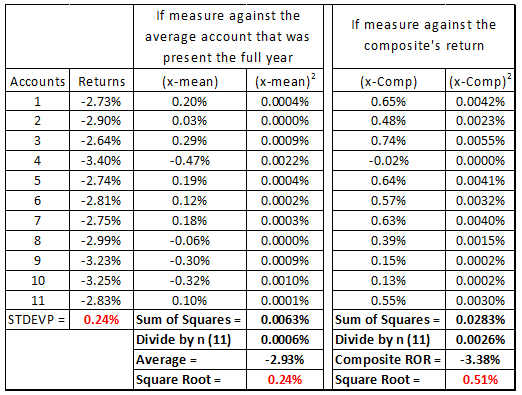
It’s hard to say. I’m sure that there are many times when the differences are immaterial, while at others sizable differences can result. I ran the numbers for one of our client’s composites (returns have been adjusted here, but without any loss of representativeness):
The client showed dispersion of 0.24%; I suspected it came from the sample of 11 accounts (the composite had 29 accounts throughout the year, 11 present the full year). I used Excel to confirm our client’s number, and then did it the long way, by measuring the dispersion around the average of this sample (+2.93%); and, as you can see, my result (0.24%) tied out.
I then manually calculated dispersion around the composite’s return (+3.38%) and found a significantly different standard deviation result: 0.51 percent.
Why does GIPS require firms to report dispersion?
The requirement for dispersion has its origin with the second edition of the AIMR-PPS® (AIMR Performance Presentation Standards), which was published in 1997. Knowing what a manger’s return was is important information, but knowing how consistent they were in managing the accounts is also important. Therefore, to gain some insights into the dispersion a composite’s constituent account’s performance has value.
But do we want to know how consistent the manager performed for this group, or relative to the composite’s return? I think the latter.
Conclusion Dispersion
I believe that as with the use of the aggregate method for composite returns, the use of dispersion measures that fail to use the composite’s return are measuring the wrong thing. However, just as with the aggregate method, this approach is well entrenched within our industry.
The purpose for this post is mainly to provide some insights into what is really going on, for folks to ponder this, and perhaps to come to their own conclusions and ideas.
More research would be needed to determine the extent of what might be considered “misleading dispersions” being reported. In the mean time, perhaps the Standards could require firms to report the average return of the accounts which make up this sample (of accounts present the full year). Or, to require firms to explain whether their dispersion is around the composite return or the average of accounts present the full year. The ideal would be to set a date (perhaps January 2020) by which time dispersion must be adjusted so that it’s around the composite returns.
Just some thoughts … discussion would help, I suspect, and as always, your ideas and reactions are invited and welcome.
And, to learn more about our GIPS verification services, please go here, or contact Chris Spaulding or Steve Sobhi.